How Much Does Where We Live Shape How We Move?
Notes from the Portland Posture Clinic U.S. Posture Research Project
In 2025, I began a cross-country posture research project for Portland Posture Clinic. The trip was geographic market research: an opportunity to observe posture and movement patterns across different states and regions, collect field observations, and investigate whether Americans appear to use their bodies differently depending on where they live.
The project also supports the development of proprietary educational content for publication and advertising, helps evaluate geographic differences that may eventually inform advertising allocation and other business expenditures, and provides material for public education intended to increase awareness of posture and movement.
This is not a controlled scientific study. I am not randomly sampling residents or measuring every person with instruments. Instead, the project combines direct population observations with existing state-level data, looking for patterns—and, perhaps more importantly, questions worth asking.
One of those questions has become increasingly important:
Does the environment around us help determine the bodies we develop?
What States Spend on Public Recreation
One way to approach that question is to look at how much state and local governments spend on parks and recreation.
According to U.S. Census-derived fiscal-year 2021–22 data, American state and local governments spent approximately $50.8 billion on parks and recreation, or about $153 per resident nationally. North Dakota led the 50 states at approximately $382 per person, followed by Utah at $310, Colorado at $307, Wyoming at $262 and Minnesota at $252. Oregon ranked eighth at approximately $210 per resident.
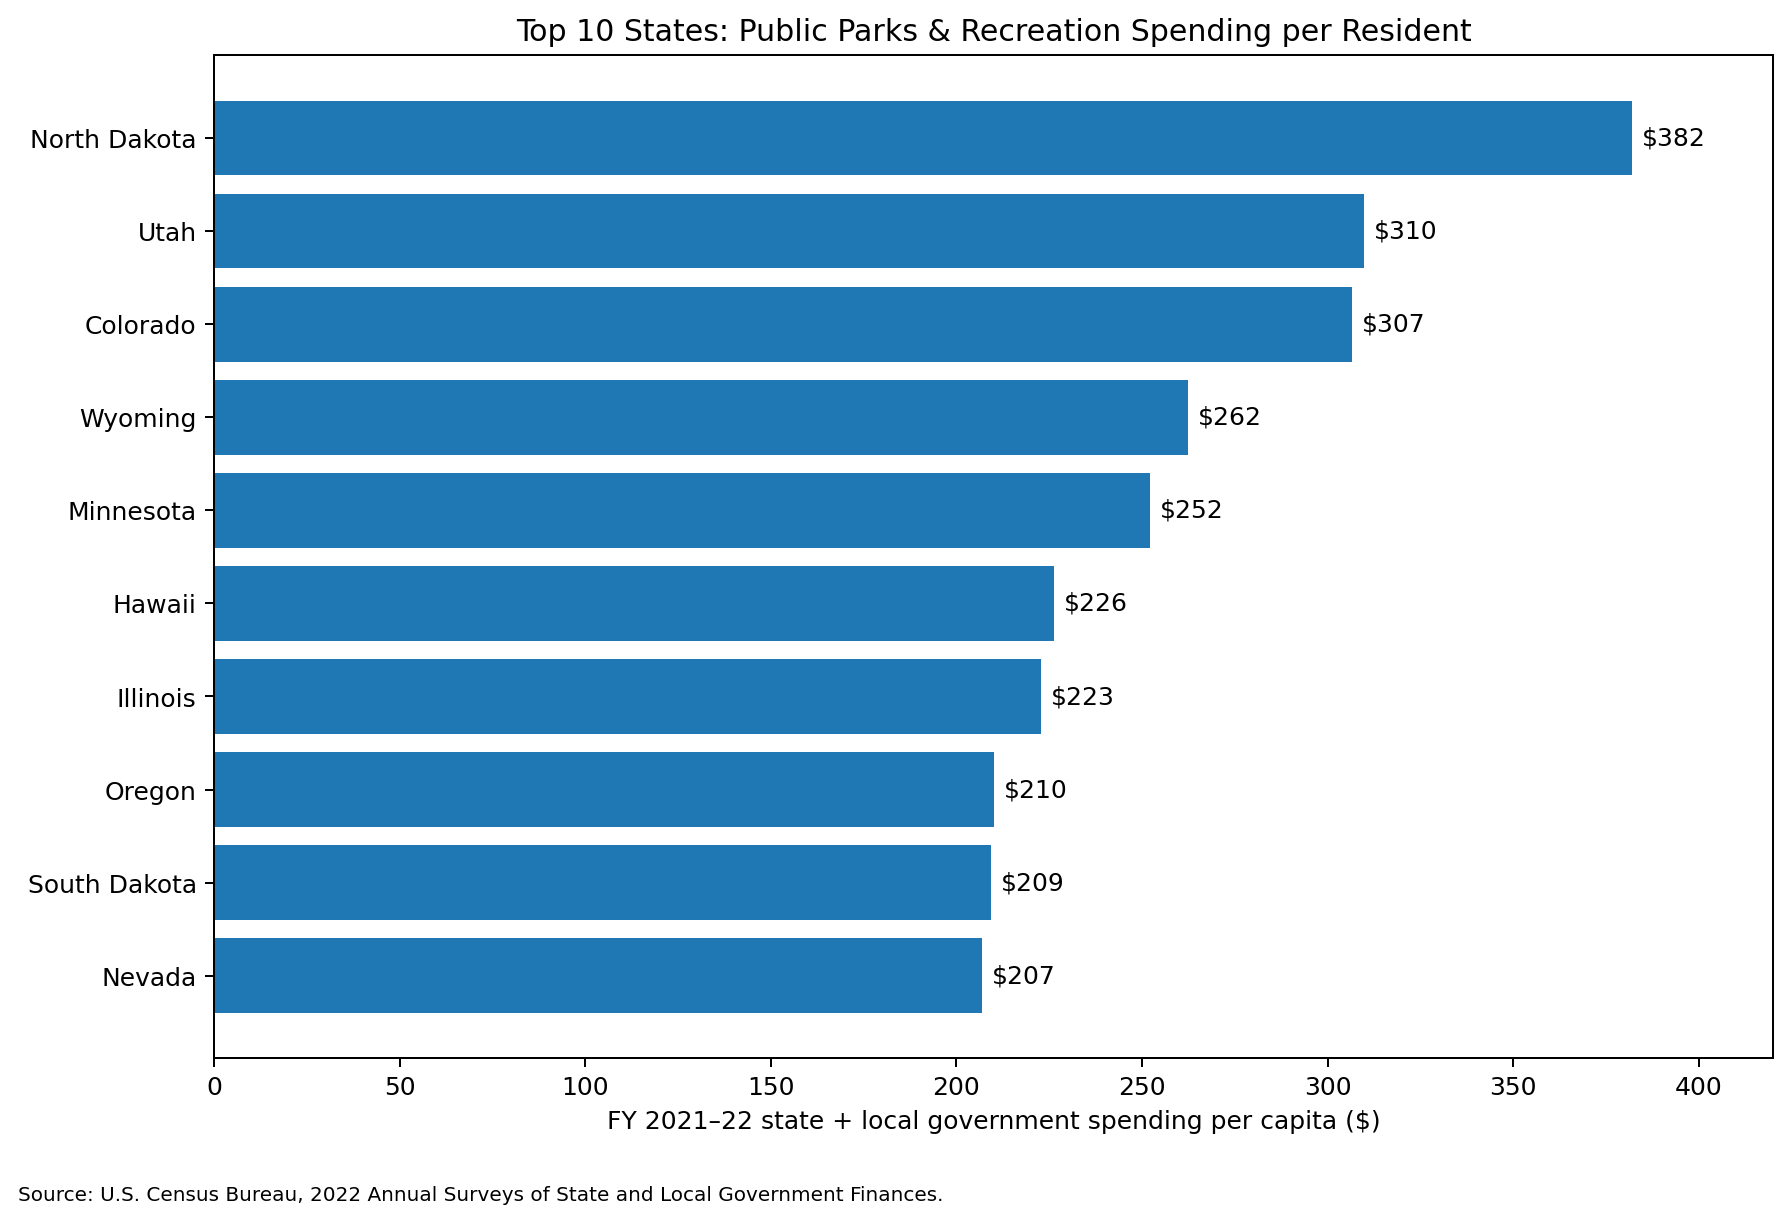
This category should not be mistaken for a pure “fitness budget.” Government parks-and-recreation spending can include parks, athletic fields, swimming pools, recreation facilities and other public amenities, along with some facilities less directly related to exercise.
Still, it gives us something useful: a rough measure of how much public money a state and its local governments devote to environments in which recreation can occur.
And the rankings produce some surprises.
Illinois spends about $223 per person, seventh highest nationally. South Dakota ranks ninth at $209. Yet Vermont spends only about $127, Montana $132, New Hampshire $83 and Massachusetts $83.
If recreation spending alone produced active, adaptable bodies, we might expect those rankings to resemble physical-activity rankings closely.
They don't.
Building a Movement Environment Index
That led me to create a working Movement Environment Index (MEI) for the posture project.
Rather than asking only how much government spends, the MEI asks a broader question:
How strongly does a state's environment appear to support everyday movement?
The current version combines seven factors: access to exercise opportunities, actual participation in aerobic and strength exercise, public parks-and-recreation spending, physical inactivity, automobile dependence, natural-resource investment and federal public-land availability.
Access matters because proximity to parks and recreational facilities is associated with greater opportunities for physical activity. Transportation matters because people who walk, cycle or combine transportation modes generally accumulate more physical activity than people who travel almost exclusively by car.
Exercise behavior matters too. In 2023, only 30.4% of U.S. adults met both the federal aerobic and muscle-strengthening guidelines. Colorado led the states at 35.4%.
The resulting MEI puts Colorado first at 88.8, followed by Oregon at 85.9, Utah at 82.6, Hawaii at 81.9 and Washington at 79.4.
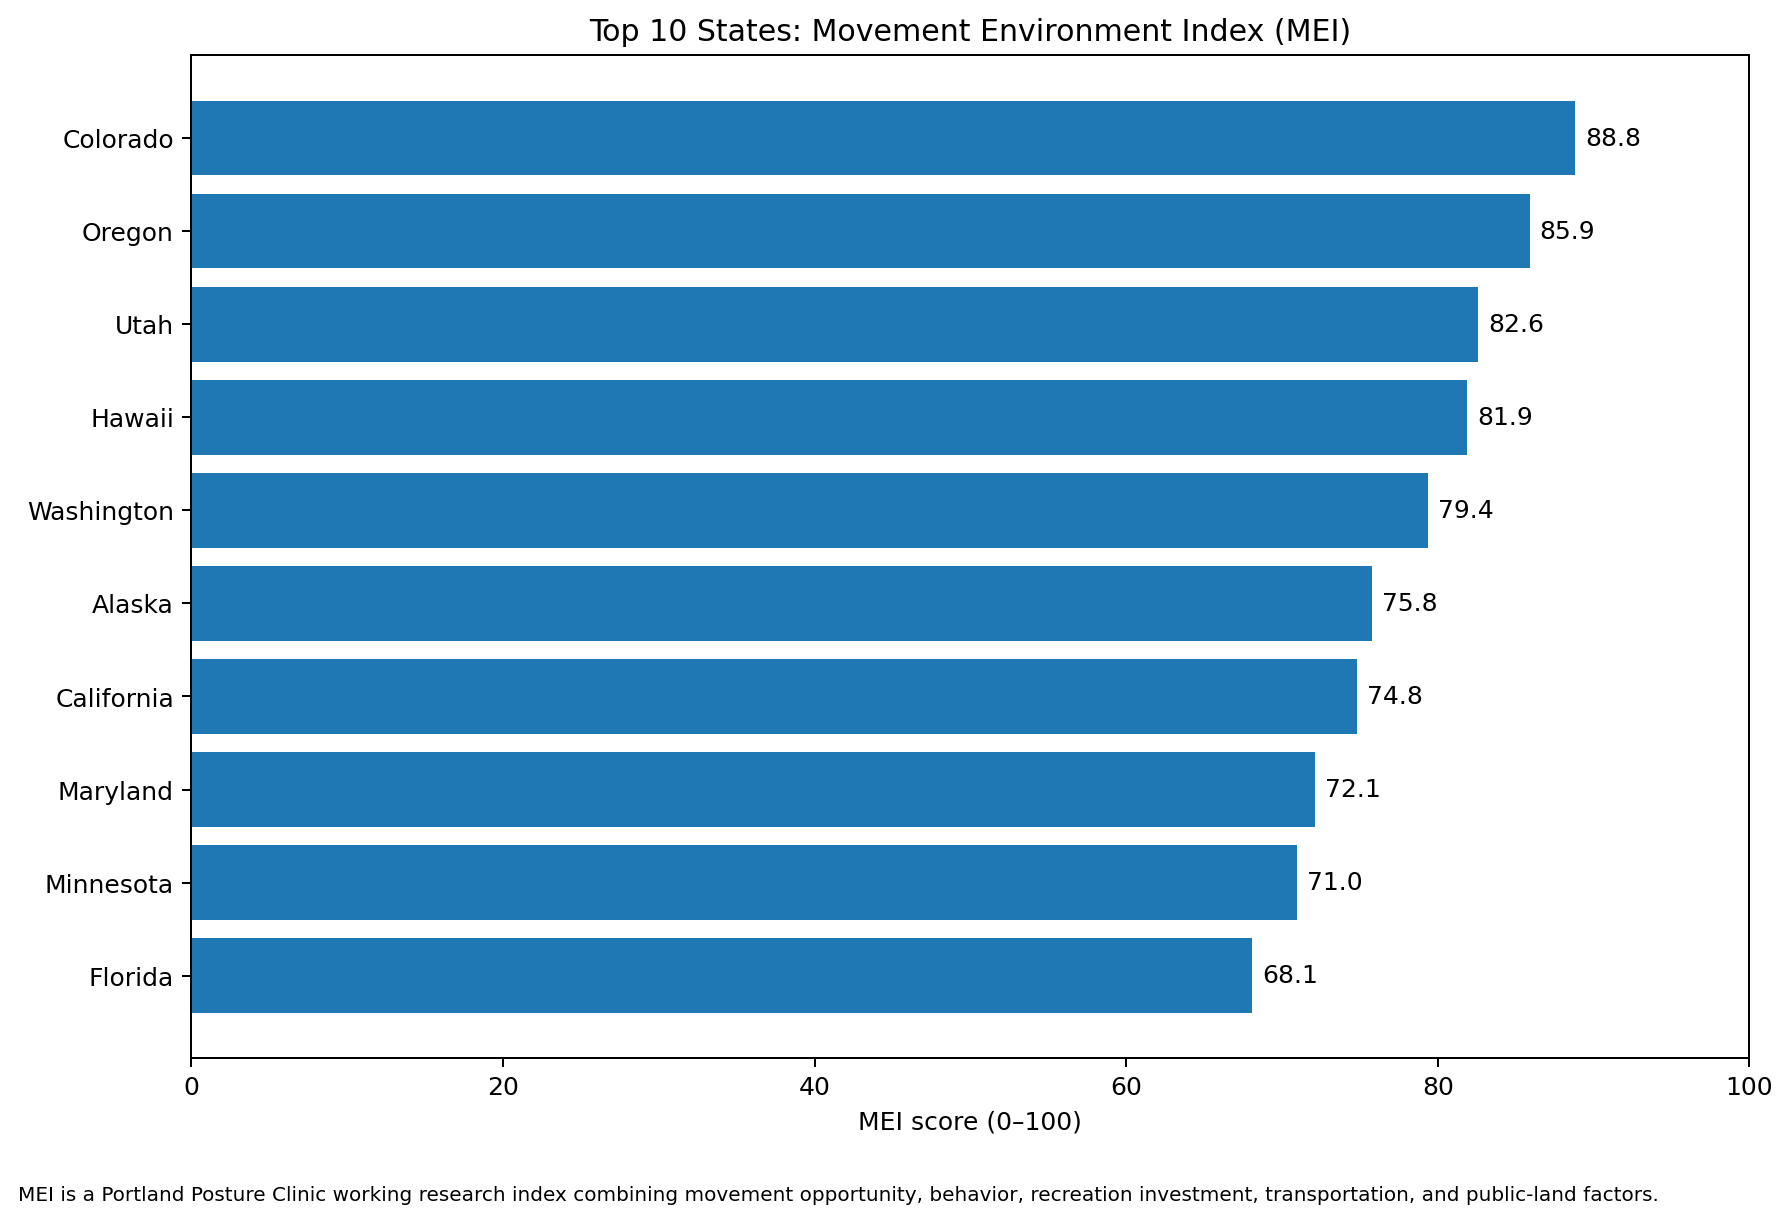
The MEI is not an established public-health statistic. It is a working Portland Posture Clinic research tool designed to organize several potentially relevant environmental variables into one comparison.
And its disagreements with the spending rankings may be more interesting than its agreements.
North Dakota is first in recreation spending but only 25th in the MEI. Illinois is seventh in spending but 18th in MEI. Meanwhile Oregon is eighth in spending but second in MEI.
Montana presents an especially interesting case. It ranks only 28th in recreation spending and 14th in MEI, yet nearly 29% of the state is federally administered land. Oregon is more than 52% federal land and Utah about 63%.
That raises a possibility I became increasingly interested in while traveling:
Formal recreation infrastructure may not be the same thing as a movement-rich environment.
A person in Vermont or Montana may not live near a large municipal recreation center but may regularly hike, ski, work outdoors, carry equipment, climb uneven terrain or move through environments requiring constant small adaptations.
Conversely, someone can live beside an excellent urban park, belong to a gym, and still spend most waking hours seated.
From Movement Quantity to Postural Adaptability
This distinction may ultimately be central to my posture research.
Public spending tells us what communities build.
Exercise statistics tell us something about what residents do.
But posture may also reflect how varied that movement is.
A treadmill provides movement. A rocky trail provides movement plus balance, rotation, visual orientation, foot adaptation and constant adjustments through the hips and trunk.
Likewise, walking several miles through New York is unquestionably movement—but doing it while staring downward at a phone creates a different mechanical environment.
So the question I am pursuing is becoming broader than, “Which state has the best posture?”
It is:
Which environments give people the greatest opportunity to maintain bodies that remain adaptable?
The healthiest posture may ultimately prove to be less about achieving one ideal position and more about retaining the ability to comfortably use many of them.